Navigating The Dashboards
Designed to be user-friendly, here's a quick guide on finding your way through to each of your dashboard pages.
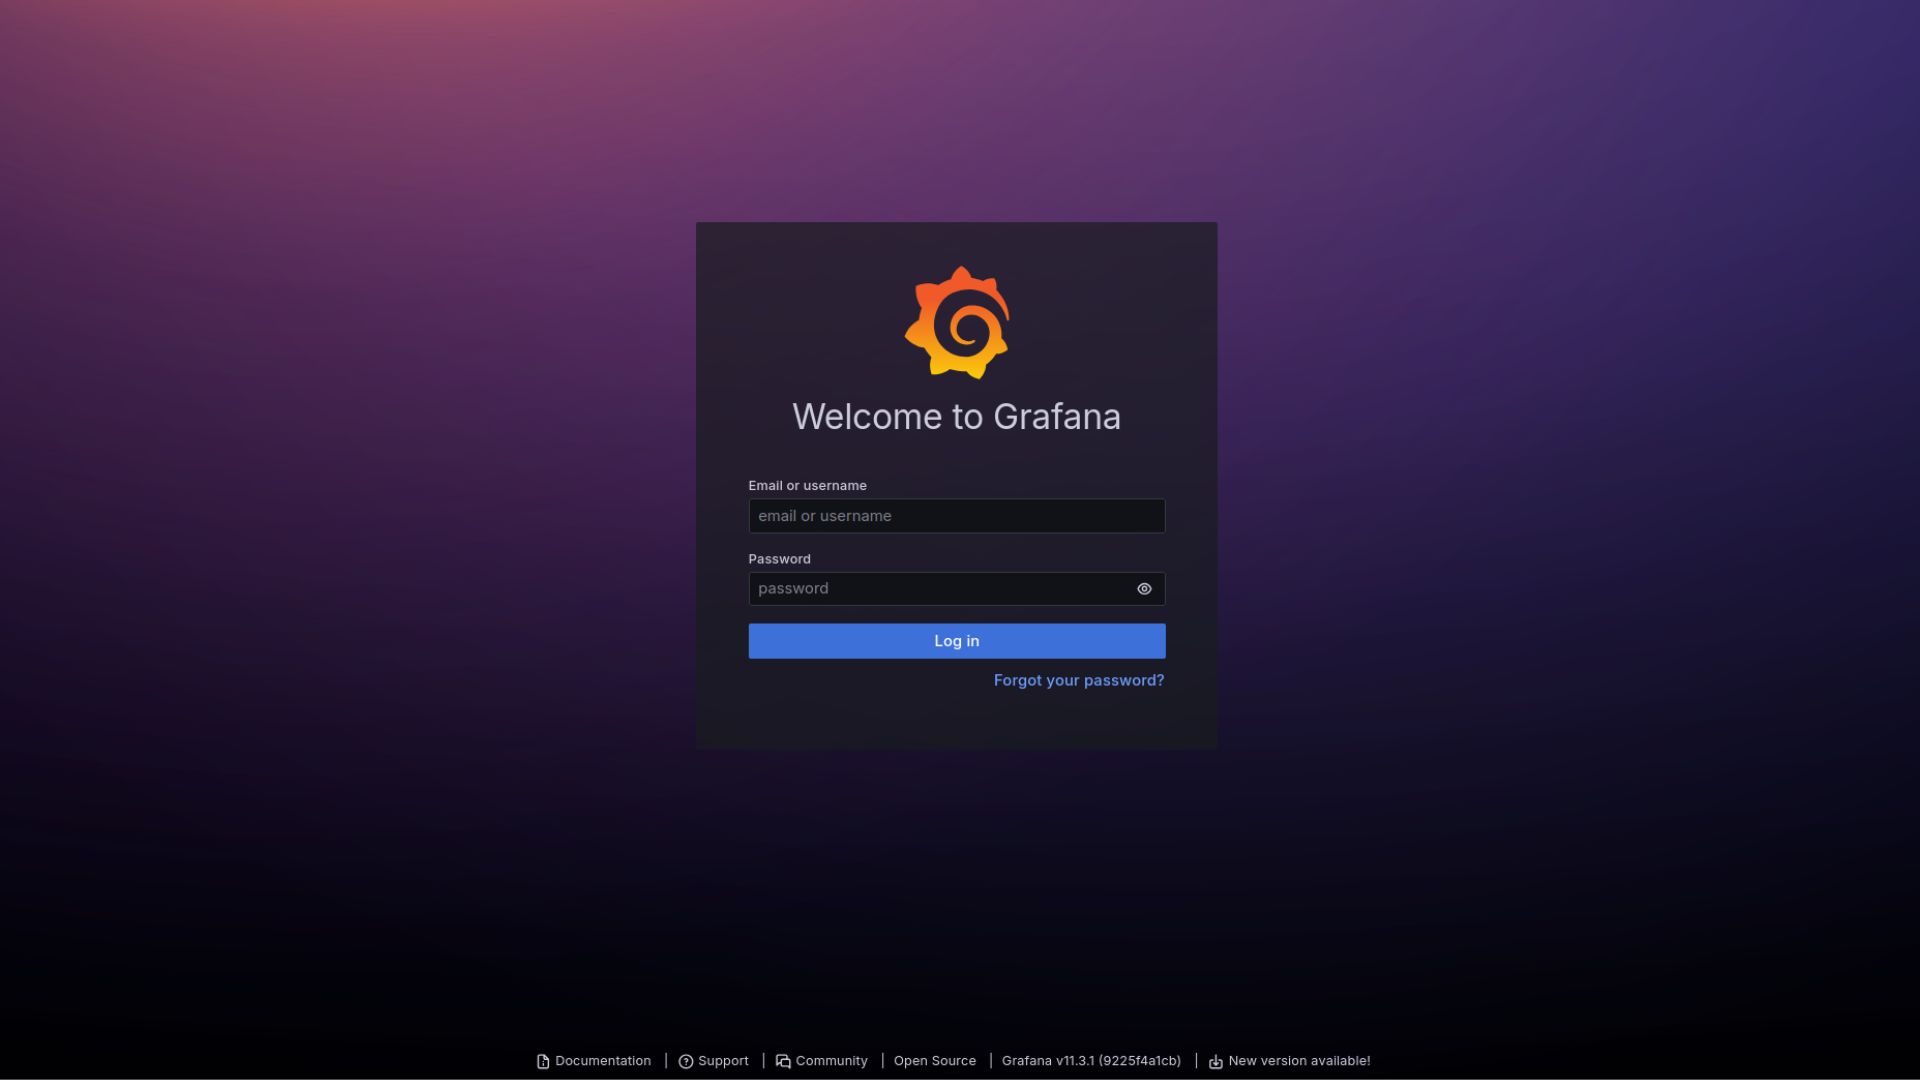
The Login Page
As soon as your solution is shipped, you should receive an email titled "Welcome to OpenSmartMonitor" or OpenSmartMonitor Welcome Pack". Here you will find your dashboard link, username, and password. As with any login page, this requires the input of the username and password our team would have provided you with. Simply copy and past the provided details into the text boxes and press login.
If for any reason your link or login details do not work, please contact our team on support@devtank.co.uk and we will assist you with this issue.