State of Open
The State of Open Conference 2023 is a major gathering of individuals and organizations focused on promoting open-source technologies and collaborative efforts to advance innovation in the tech industry. This conference provides a platform for experts and enthusiasts to share their knowledge and ideas on the latest trends, challenges, and opportunities in open-source technologies. The major parties involved in the conference are leading technology companies, open-source software developers, academics, and policymakers who share a common goal of advancing open-source technologies and fostering collaboration in the tech industry. Speakers from across the world are invited to this event include The White House and Wikipedia. Google, Microsoft and innovate UK are just some of the major sponsors of this event.
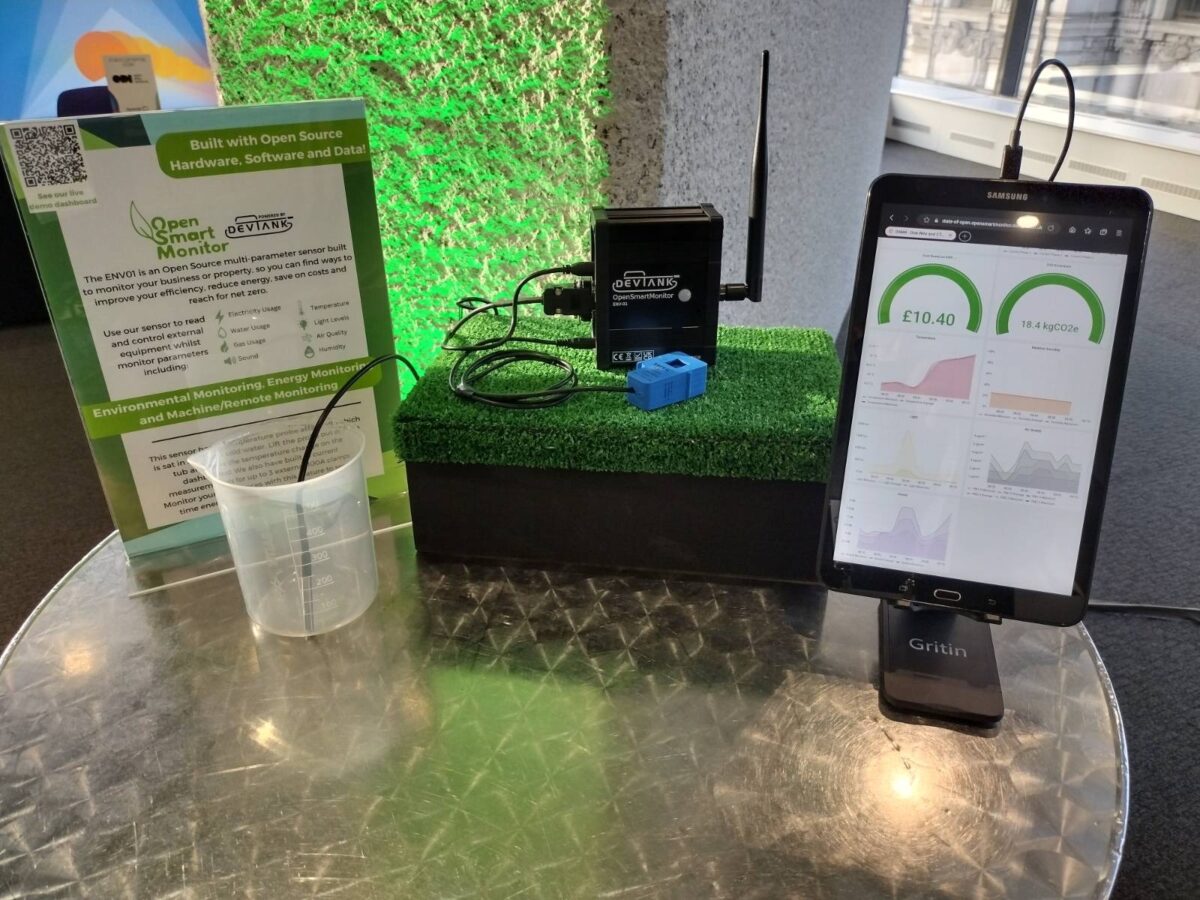
Devtank showcased our OpenSmartMonitor sensors that were strategically placed around the building to collect environmental data. In addition, Tim Telford, our CTO/Hardware expert, delivered a talk on how our IoT sensors can aid businesses in their journey towards Net Zero, not only by reducing carbon emissions but also by lowering energy costs. Dr. Bruno Gallotta from the University of Derby also joined Tim to offer deeper insights into the research he has conducted on this subject, using data obtained from our OpenSmartMonitor. The talk generated insightful discussions and even led to an article titled “Net Zero: A $7 trillion open data problem” which delves into the details of what Tim and Bruno presented and how it applies to real-world situations.
https://www.computing.co.uk/news/4074197/net-zero-usd-trillion-open
Collecting Data
As previously stated, we installed four OpenSmartMonitor sensors throughout the building on various floors and in different rooms. These sensors were designed to capture environmental data, including temperature, humidity, sound, air quality, and light, all of which are standard features of our sensors. Additionally, we equipped the sensors with various interactive features such as a bicycle pump connected to a flow meter, an external temperature probe immersed in a glass of water, a modbus meter, and a tilt/vibration sensor. These features were not only designed to provide a hands-on experience for users to see how the data is collected and displayed in real-time, but also to demonstrate the diverse applications that can be achieved with our sensors.
Environmental Parameters in the Real World
Monitoring environmental factors is one thing, but using that data and understanding what it means is another. These parameters can differ greatly depending on the kind of business you run or where your business is located.
Humidity
Humidity is a measure of the amount of water vapour present in the air. It is an important factor that affects both our health and the structural integrity of our buildings. According to Assurity Consulting, low humidity levels in the workplace can lead to various health issues, including dry skin, sore throats, and respiratory problems. Additionally, low humidity can cause wooden furniture, floors, and other materials to dry out and become brittle, resulting in costly damage to buildings. Maintaining the right humidity levels in the workplace can, therefore, improve the comfort and health of employees and protect the structural integrity of buildings. The perfect humidity can be found between 40% and 70% with problems mentioned above arising when it drops below 40%. When reaching humidity levels about 70%, this when we can find more vapour in the air. In the common home this can result in condensation on windows and issues with mould. (Source: https://www.assurityconsulting.co.uk/knowledge/guides/how-does-low-humidity-in-the-workplace-affect-people)
Air Quality
Air quality refers to the level of pollutants and other harmful particles present in the air. Poor air quality can lead to a range of health issues, including respiratory problems, allergies, and heart disease. In industrial settings, such as factories, managing air quality is of particular importance due to the potential health risks to workers. According to a recent article in The Guardian, the UK’s Chief Medical Officer, Chris Whitty, has called for the monitoring of indoor air quality in public places, including factories, to help prevent the spread of airborne diseases and improve overall health and safety. Failure to manage air quality in factories can not only result in serious health risks for workers but also lead to negative environmental impacts, including increased carbon emissions and pollution. (Source: https://www.theguardian.com/environment/2023/feb/08/indoor-air-quality-should-be-monitored-in-public-places-says-chris-whitty)
Sensor Locations
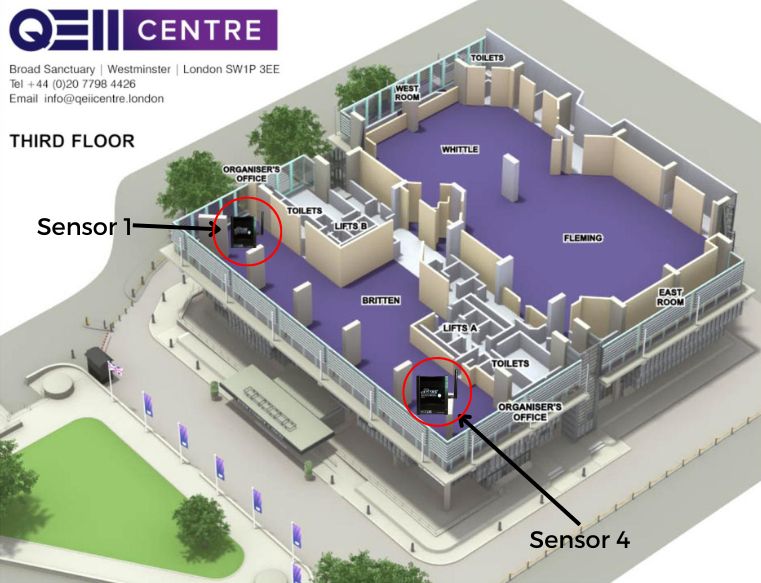
Sensor 1 – Sound
Sound at large events like State of Open Con can vary depending on head count in a room. The larger the crowd, the more you have to fight to talk. During the normal event times of day one, the sound levels can be seen fluctuating between 76dB and 82dB. However, at 8:30am as doors opened, it can be found to be 65.8dB. You can also see that overnight it drops massively to just over 35.1dB noise floor, with the odd spike throughout the night. These spikes could be anything from cleaners to people and traffic outside the venue. The loudest peak, however, comes from during the after party at 90dB… Must have been a good one!
Sensor 1 – Temperature
It has been found that humans typically radiate around 100W of heat and, as we all know, a lot of people in a confined space will cause a rise of temperature. As the doors open at 8:30am, this room is at 20.7 °C. However, as the day progresses and more people pack the room, by 2:30pm it has jumped to 29.4 °C!
Sensor 1 – Humidity
During this event, we were measuring the relative humidity of the sensor locations. Relative humidity is the percentage of water vapour relative to the air temperature. This is why, between sensor 1’s temperature and humidity, a pattern can be found. As the humidity drops, the temperature can be seen to rise. This is due to the amount of water vapour being low, which ultimately makes for a warmer temperature. A nice level of humidity can be seen between 40% and 55% as this means the air isn’t too dry or too moist. The humidity at SOOCon23 was initially 25% at 8am, dropping by 2pm to 14%. If you notice that the air was dry, this is why!
Sensor 1 – Air Quality
Air Quality is a major factor when it comes to health and safety (especially in factories) and paramount to managing the air we breathe and the pollution we create. Looking at the air quality data from sensor 1, day one and two can be seen to maintain a healthy level. PM10 Maximum = 3 µg/m³ – Minimum = 2 µg/m³. PM2.5 Maximum = 2 µg/m³ – Minimum = 1 µg/m³. This is typically where it sat. But between 5:30pm and 8:30pm it reaches – PM10 Maximum = 172 µg/m³ – PM2.5 Maximum = 169 µg/m³. This was the hours of the after party! Are people really that dirty? As you will see on sensor 4, located across from this sensor, It spikes at the same time, but not as high. This correlation suggests it’s particles from people gathering around the sensor. A mixture of peoples breath and possibly cleaning sprays could have contributed to this spike.
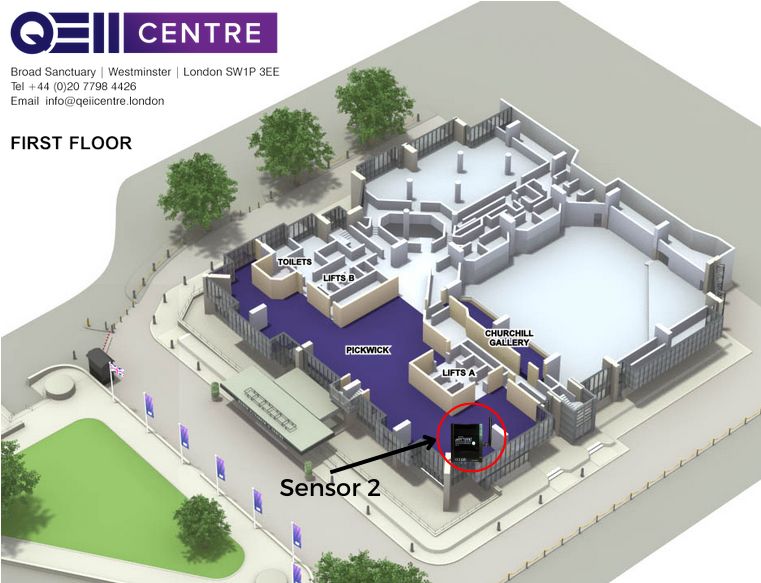
Sensor 2 – Air Quality
Now we have gone through our first sensor, this is were it gets a little repetitive as most of the data correlates with the other 3 sensors. Sound levels, Temperature and Humidity all were found to be pretty similar to that of sensor one.
Focusing on the air quality of sensor two, it displays a similar yet slightly different outcome. Throughout both days of SOOCon, it can be seen sitting very low! I know right, very clean air! PM10 Maximum = 0 µg/m³ … yup 0…! Hold up, there’s another massive spike! This time it’s not the after party, but the start of Day 2. PM10 Maximum = 309 µg/m³ and PM2.5 Maximum = 304 µg/m³. Could this be cleaning spray?
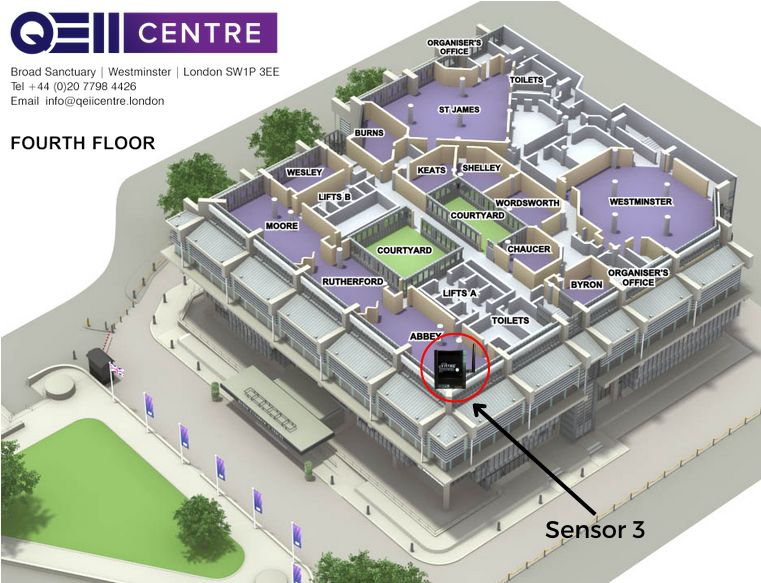
Sensor 3 – Sound
This room was the loudest of our locations with the event sitting between 75dB and 95dB. Bear in mind that the party hit 90dB on sensor 1, this room must have been busy!
Sensor 3 – Temperature
Again, a lot of similarities with the data from sensor 3, but let’s pick out the biggest differences. Starting with temperature. This room was by far the warmest of our sensor locations. Day 1 started at a reasonable 21 °C, which by 12.20pm hit the day’s maximum with 30.8 °C! Day 2, however, started again at 21 °C, but ended up hitting 32.5 °C by 3pm. TOASTY! Floor 4 had a lower ceiling compared to that of sensor one on the 3rd floor. This could suggest that floor 4 was warmer due to having less ceiling height for the heat to rise.
Sensor 3 – Air Quality
Sensor 3’s air quality can be found to be between 7 µg/m³ and 4 µg/m³ which is pretty standard for the kind of room. The largest peak seen on this data graph only reaches 15 µg/m³ as people turn up for the start of day 2.
Sensor 4 – Air Quality
Sensor 4 also picked up data relating to the after party. You can see it jumps to a maximum of 22 µg/m³ during these hours. The regular days, however, were a little higher than the others, being between 3 µg/m³ and 10 µg/m³.